A Guide to Mastering Sales Efficiency Metrics
Unlock sustainable growth with our guide to sales efficiency metrics. Learn to track, analyze, and improve the KPIs that drive predictable revenue.
What are sales efficiency metrics, really?
They’re the numbers that tell you how good your sales team is at turning resources—time, money, and sheer effort—into actual revenue. They cut through the noise of daily activity to answer one simple, critical question: "Are we growing smartly?"
Nailing these metrics is what separates a team that’s just busy from a team that’s truly profitable.
Why Sales Efficiency Is Your New Competitive Edge
Let's be honest, the "growth at all costs" playbook is dead. Today, sustainable success comes down to something much smarter: sales efficiency.
This isn't about cracking the whip and demanding more calls or emails. It's the opposite. It’s about arming your reps to work smarter by focusing their energy where it actually pays off.
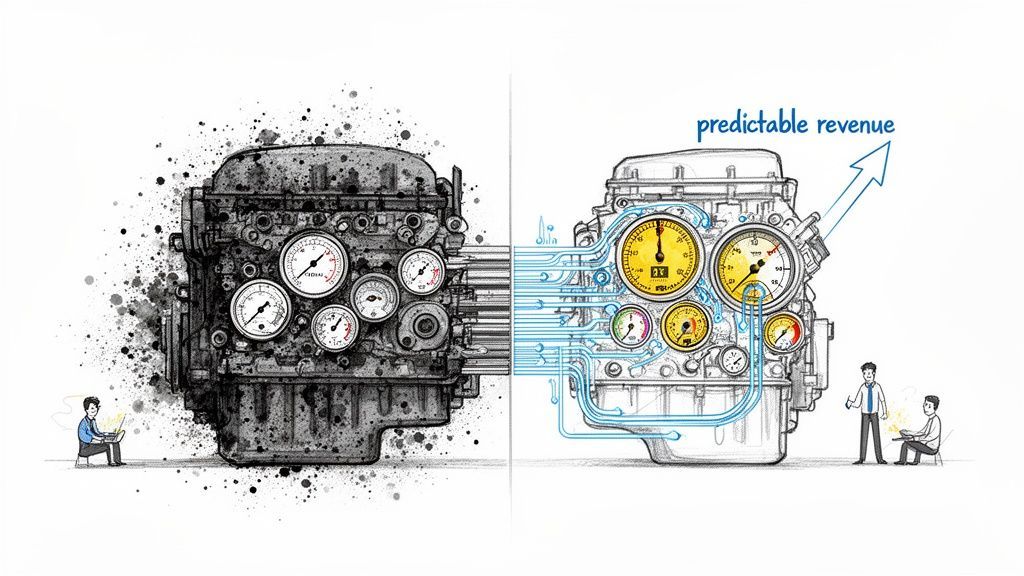
Think of your sales organization as a high-performance engine. You can dump all the fuel you want into it—leads, budget, talent—but if that engine is clogged with bad data or clunky processes, you’re just burning cash for a lot of noise and smoke. A team running without clear sales efficiency metrics is doing exactly that: lots of motion, but with costly, unpredictable results.
The Foundation of Predictable Growth
When you start tracking and improving these metrics, you’re not just chasing numbers. You’re building a stronger, more resilient business. The benefits ripple out across the entire company.
- Predictable Revenue: Stop guessing and start forecasting with real confidence. Efficient processes produce consistent results you can actually bank on.
- Lower Customer Acquisition Costs (CAC): When you trim the fat from your sales motion, you spend less time and money landing each new customer. That drops straight to your bottom line.
- Strategic, Scalable Growth: Efficiency is the blueprint for healthy expansion. It lets you grow your team and operations without watching your costs spiral out of control.
The big idea is simple: focus on the quality of sales activities, not just the quantity. An efficient sales engine pulls in more revenue from the same—or even fewer—resources. It’s a non-negotiable shift for any business that wants to thrive, no matter the economic climate.
Data as the Starting Point
Of course, none of this works without a foundation of clean, accessible data. You can't fix what you can't see.
If your CRM is a mess of inaccurate or incomplete information, calculating meaningful metrics is impossible. You can't spot bottlenecks or make informed decisions. This is exactly why tools that eliminate manual data entry are no longer a nice-to-have; they're essential.
When your team captures accurate prospect data from the very first touchpoint, every single metric you track becomes more reliable. To see how this plays out in the real world, check out our deep dive into the practical side of achieving true efficiency in sales.
Get your data hygiene right from the start, and you'll set the stage for a truly efficient and predictable revenue machine.
The Six Core Metrics of Sales Efficiency
To get a real handle on sales efficiency, you have to know what to measure. While you could drown in data points, a handful of core sales efficiency metrics will always point you in the right direction. Think of them as the vital signs for your sales team.
These aren't just numbers to fill a spreadsheet. They’re diagnostic tools. They tell a story about where your sales engine is firing on all cylinders and where it needs a tune-up. By focusing on these six, you can move past tracking busy work and start measuring what actually drives revenue.
Your Quick Guide to Core Sales Efficiency Metrics
Here's a quick look at the metrics we're about to unpack. This table gives you an at-a-glance overview of what each one tells you and how to calculate it.
| Metric | What It Measures | Formula |
|---|---|---|
| Revenue Per Sales Rep | The average revenue generated by each salesperson. | Total Revenue / Number of Reps |
| Sales Cycle Length | The average time it takes to close a deal from start to finish. | Total Days to Close All Deals / Number of Deals |
| Lead-to-Opportunity Rate | The percentage of leads that become qualified opportunities. | (Qualified Opportunities / Total Leads) x 100 |
| Quota Attainment | The percentage of the sales team hitting their sales targets. | (Total Sales / Sales Quota) x 100 |
| Time on Non-Selling Tasks | The amount of time reps spend on administrative work. | Total Hours Worked - Hours Spent Selling |
| Customer Churn Rate | The percentage of customers lost over a specific period. | (Lost Customers / Total Customers at Start) x 100 |
Now, let's dig into what each of these really means for your team's day-to-day performance.
1. Revenue Per Sales Rep
This is the bedrock metric for individual output. It cuts right to the chase: how much revenue is each rep bringing in over a set period? It’s the clearest way to establish a performance baseline, spot your top players, and see who might need a bit more coaching.
A healthy revenue-per-rep figure is a direct indicator of your team's overall strength and ties every single person’s output directly to the company's bottom line.
2. Sales Cycle Length
How long does it take your team to get a deal from "hello" to a signed contract? That's your sales cycle length. The shorter it is, the faster you’re turning leads into cash, which directly lowers your Customer Acquisition Cost (CAC).
Think of your sales process like an assembly line. The faster you turn raw materials (leads) into finished goods (closed deals), the more profitable the whole operation is.
Key Insight: A long or lengthening sales cycle is a huge red flag. It’s almost always a symptom of hidden friction—maybe your approval process is a nightmare, your reps aren't qualifying leads properly, or they’re just bogged down in admin work instead of selling.
3. Lead-to-Opportunity Conversion Rate
Let’s be honest: not all leads are created equal. This metric shows you what percentage of your leads are actually good enough to become real, qualified opportunities in your pipeline. A low conversion rate could mean marketing is sending over poor-quality leads, or your sales team is struggling to qualify them effectively.
Tracking this is the ultimate quality check between marketing and sales. It ensures your reps are spending their precious time on prospects who have a genuine chance of buying.
4. Quota Attainment
This is the classic scorecard for any sales team. Quota attainment simply measures the percentage of reps who are hitting or blowing past their sales targets. It’s a powerful reflection of two things: individual performance and whether the goals you’ve set are actually realistic.
If only a couple of superstars are hitting their numbers, your quotas might be too high or the rest of the team needs better training. But when attainment is high across the board, you know you have a healthy, well-oiled sales machine.
5. Time Spent on Non-Selling Activities
One of the biggest silent killers of efficiency is all the time reps waste on tasks that have nothing to do with talking to customers. We’re talking about manual CRM updates, endless internal meetings, and building prospect lists from scratch. Studies have shown reps can burn up to two-thirds of their day on this stuff.
Cutting down on this admin time is the fastest path to boosting your team’s output. When you free reps from the busywork, they can focus on what they were hired to do: build relationships and close deals. For a deeper dive, you can learn more about how to measure sales productivity and the impact it has.
6. Customer Churn Rate
Finally, great sales efficiency isn't just about winning new logos—it’s about keeping the customers you fought so hard to win. Your churn rate is the percentage of customers who cancel or don't renew over a certain period.
High churn is like trying to fill a leaky bucket. It constantly eats away at your revenue and forces your sales team to work twice as hard just to stay afloat. It often points to a disconnect between what was promised in the sales process and the actual customer experience, making it a vital metric for stable, long-term growth.
How Pipeline Velocity and Win Rates Tell the Real Story
While the basic metrics give you a snapshot of individual activities, a few heavy-hitters reveal the true health of your entire revenue engine. At the top of that list are pipeline velocity and win rates. These don't just measure what your team is doing—they measure how quickly and effectively those actions turn into closed deals.
Think of pipeline velocity as the pulse of your sales operation. It’s a single, powerful number that tells you how much revenue is moving through your pipeline every single day. It’s not about how many deals you have; it’s about their value, your odds of winning them, and the speed at which you close them.
This flowchart breaks down some of the core components that feed into your overall sales efficiency.
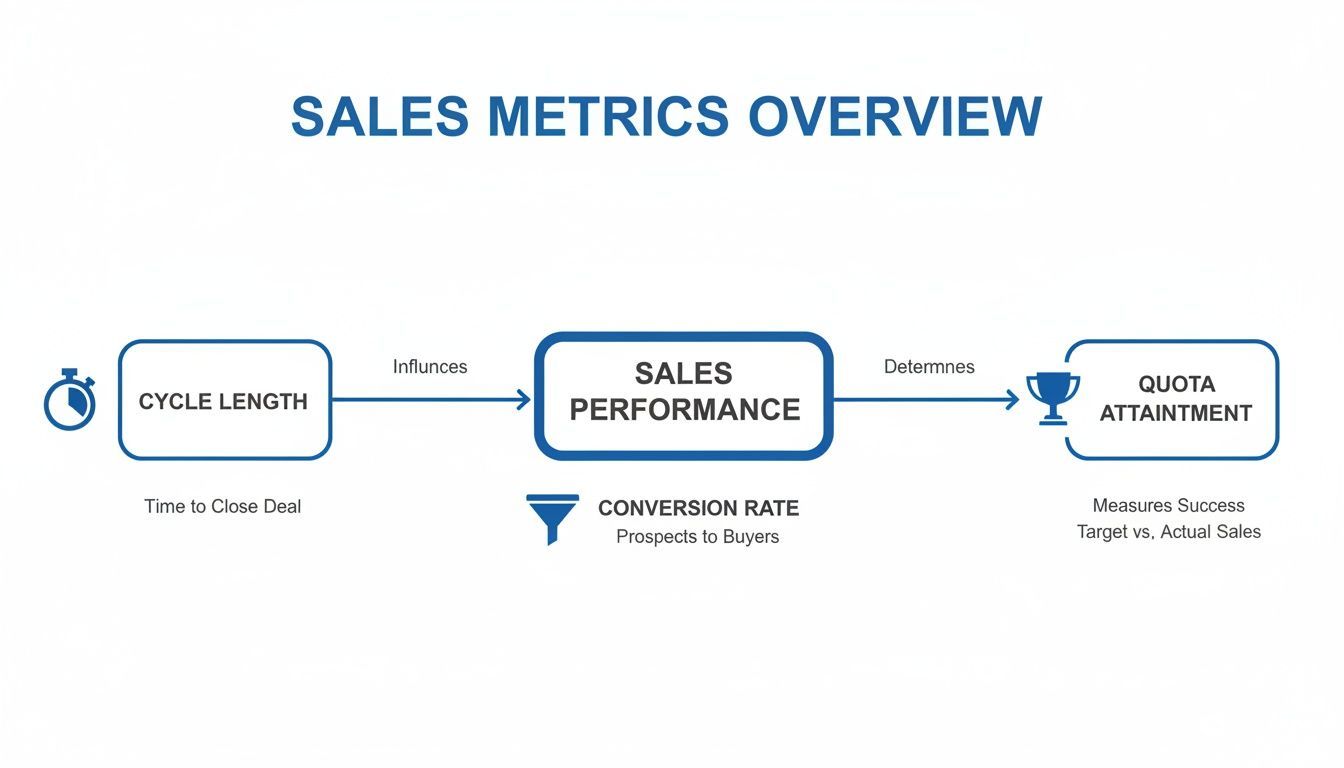
As you can see, things like sales cycle length, conversion rates, and quota attainment are all interconnected. A small improvement in one area can create a major lift across the board.
Calculating Your Pipeline's Speed
In B2B sales, speed kills. That's why pipeline velocity is such a critical metric—it tells you exactly how fast revenue is flowing through your sales funnel. The formula is: (Number of opportunities × Average deal size × Win rate) ÷ Sales cycle length.
This calculation wraps volume, value, success probability, and speed into one number. Top teams are obsessed with this KPI because it directly impacts revenue predictability. In fact, teams that actively optimize their pipeline velocity see up to 23% higher revenue growth than their peers. You can explore more insights on key sales metrics at monday.com.
The real magic here is leverage. You don't need a massive overhaul to see a big impact. A small improvement in any of the four variables—more qualified opportunities, a slightly higher average deal size, a better win rate, or a shorter sales cycle—can dramatically accelerate your revenue.
For instance, just by shrinking your average sales cycle from 90 days to 80 days (while keeping everything else the same), you get a 12.5% boost in pipeline velocity. That’s a serious revenue lift from tightening up just one part of your process.
Using Win Rates as a Diagnostic Tool
Your overall win rate is a great top-level indicator, but its real power comes from breaking it down by sales stage. This shows you exactly where deals are getting stuck or falling out of your funnel. It's the difference between knowing you have a fever and knowing precisely where the infection is.
A low conversion rate from "Discovery" to "Proposal" isn't a proposal problem—it's a discovery problem. It signals that reps aren't qualifying effectively or uncovering enough pain to justify moving forward.
By analyzing stage-by-stage conversions, you can pinpoint specific weaknesses and fix them with targeted coaching or process tweaks.
- Low Discovery-to-Demo Rate? Your reps might need better training on initial qualification and digging into customer needs.
- High Drop-off After Proposal? Maybe your pricing isn't clear, or reps aren't communicating the value powerfully enough.
- Deals Stalling in Negotiation? Your team may need stronger objection-handling skills or clearer guidelines on discounting.
This level of analysis is only possible with clean, accurate data in your CRM. When reps can capture enriched prospect info right from the start using a tool like Add to CRM, qualification improves, and those early-stage conversion rates get a lift. This creates a direct ripple effect, shortening the sales cycle and boosting the overall win rate—the two most critical levers for cranking up your pipeline velocity.


Find verified contact data on LinkedIn®
Add to CRM finds verified emails, phone numbers, and job titles on LinkedIn® — then adds them to your CRM in one click.
Start Free TrialHow to Slash Admin Time and Shorten Your Sales Cycle
Two of the biggest levers you can pull for better sales efficiency are the length of your sales cycle and the time your reps sink into admin work. These two aren't just related; they're chained together. Every hour a rep loses to manual data entry, prospect research, or updating CRM records is an hour they aren't spending moving a deal forward.
This lost time acts like a drag parachute on your entire sales motion. It needlessly stretches out the sales cycle, bloats your customer acquisition costs, and frankly, makes for a frustrating day for both your reps and your prospects. And we all know that the longer a deal sits in the pipeline, the more likely it is to die there.
The True Cost of Administrative Drag
Think of your sales cycle as a race. Manual tasks are the hurdles scattered randomly across the track. Your best rep might clear them, but it slows them down and drains their energy—energy that should be spent actually winning the race.
Studies consistently show that sales reps can spend up to two-thirds of their day on activities that don't involve selling. That's not just a little inefficient; it's a massive opportunity cost bleeding your team dry.
When a rep spends 15 minutes manually typing a new lead's info into the CRM, that's 15 minutes they could have spent on a follow-up call that might have shaved a week off a deal. These little delays compound, turning a potential 60-day cycle into a 90-day marathon.
This administrative burden is a primary driver of longer sales cycles. If you want to shrink the time it takes to close a deal, you have to attack the root cause: the soul-crushing manual work. For a deeper dive on what a healthy timeline even looks like, our guide on the average sales cycle offers some great benchmarks.
From Wasted Hours to Closed Deals
Let's walk through a scenario we've all seen. An SDR, Alex, is prospecting on professional networks. Without the right tools, the process is a painful slog: find a good profile, tab over to the CRM, search for duplicates, copy-paste the name, title, company, then hunt for a verified email. This whole dance can easily take 5-10 minutes for a single lead.
Now, imagine Alex is using a tool like Add to CRM. The entire workflow gets a complete makeover.
- Instant Capture: Alex finds a lead and, with one click, the extension grabs all the key data points—name, company, title, you name it.
- Duplicate Prevention: Before anything happens, the tool instantly checks the CRM to see if the contact is already there, keeping your data clean.
- Data Enrichment: It automatically finds and verifies the prospect's professional email, hitting an impressive 96% accuracy rate.
- CRM Sync: The clean, enriched record pops right into the CRM, perfectly mapped to the correct fields.
What once took ten minutes now takes ten seconds. If Alex does this for 30 leads a day, the time savings are staggering.
- Time Reclaimed: Alex gets back over 4 hours every single week.
- Increased Activity: That reclaimed time goes straight into high-value work—more personalized outreach, faster follow-ups, and more discovery calls booked.
- Shorter Sales Cycle: Faster follow-ups mean prospects move through the funnel quicker. Deals that used to stall for days now get a response in hours.
This isn't just a nice-to-have gain. By killing the administrative friction at the very top of the funnel, Alex can engage more qualified prospects, faster. This directly compresses the overall sales cycle length, boosting one of the most critical sales efficiency metrics and putting more revenue on the board for the whole team.
Building Your Sales Efficiency Dashboard
Alright, let's turn theory into action. Raw sales efficiency metrics are just numbers on a page until you bring them to life in a dynamic, visual dashboard. This is where you build your command center—a single source of truth that tells you exactly how your sales engine is performing at a glance.
The goal isn’t just to display data; it's to tell a story about your team's performance. A well-designed dashboard translates those complex numbers into instant, actionable insights. It helps you spot trends, celebrate wins, and tackle problems before they snowball. And while the concepts here are universal, they’re easy to build in any modern CRM like HubSpot or Salesforce.
Choosing Your Core Visuals
First things first, you need to pick the right charts for the right metrics. Each visual should serve a clear purpose, making the information behind it dead simple to understand. Here are the must-haves for your dashboard:
- Leaderboard for Revenue Per Rep: A simple bar chart is perfect for ranking individual performance. It sparks a bit of healthy competition and instantly shows you who your top performers are and who might need some extra coaching.
- Trend Line for Sales Cycle Length: You absolutely need a line graph tracking your average sales cycle over time. Is it getting shorter or longer? This visual immediately reveals whether your process improvements are actually working.
- Funnel Chart for Win Rates: Nothing beats a funnel visualization for showing your conversion rates from one stage to the next. It immediately highlights where deals are dropping off, pointing you to the exact leaks in your pipeline.
- Gauge Chart for Quota Attainment: A gauge or "speedometer" chart is a powerful way to see team-wide quota attainment. It shows progress toward the goal in a way that’s clear, motivating, and impossible to misinterpret.
This screenshot from HubSpot is a great example of how these elements come together to create a clean, effective sales dashboard.
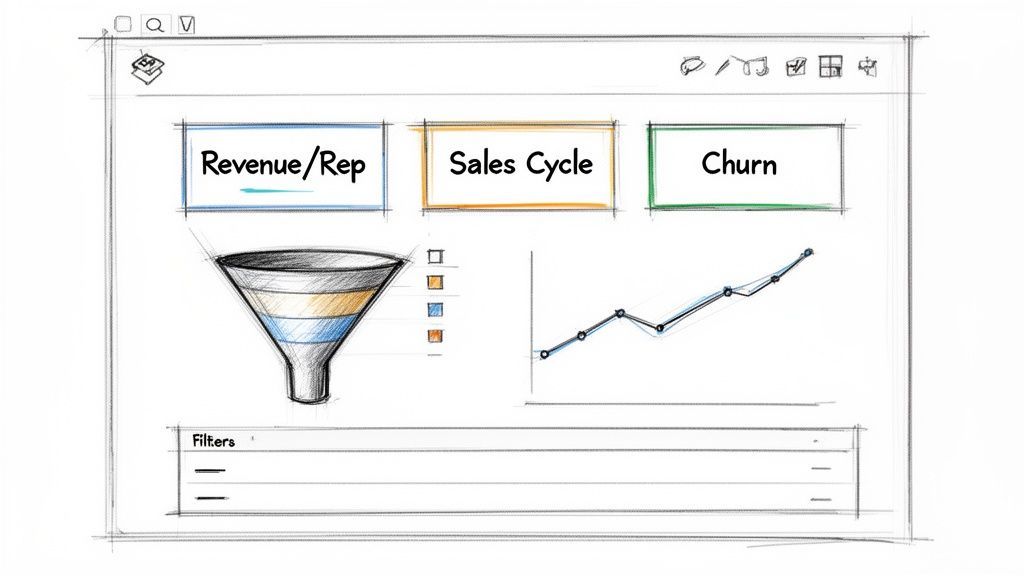
This dashboard uses leaderboards for closed deals, pipeline funnels, and trend lines to give managers a complete, at-a-glance overview of performance.
The Unbreakable Rule of Data Hygiene
Before you even think about building a single report, we have to talk about the most critical piece of the puzzle: data hygiene. A dashboard is just a pretty picture if the information feeding it is garbage. Its value is 100% dependent on the quality of the data in your CRM.
A dashboard built on messy data is worse than no dashboard at all. It doesn't just fail to give you insight; it actively misleads you into making terrible decisions.
This is why clean data entry isn't just a "nice-to-have"—it's non-negotiable. Every manual copy-paste error, every skipped field, and every duplicate contact pollutes your dataset and destroys your ability to measure anything accurately. This foundational discipline is what separates teams that truly make data-driven decisions from those who are just guessing.
Works with 27 CRMs
Add to CRM finds verified emails, phone numbers, and job titles on LinkedIn® — then adds them to your CRM in one click.
Start Free TrialUsing Metrics to Pinpoint and Fix Funnel Weaknesses
Your sales dashboard isn’t just a pile of charts and numbers. Think of it as a story unfolding in real time. Each metric is a character, every trend is a plot twist, and your job as a sales leader or RevOps pro is to read between the lines.
Learning to interpret this story is the difference between constantly reacting to problems and getting ahead of them. When a metric flashes red, it’s not just a warning; it’s an invitation to ask “why?” and start digging. Your dashboard is a diagnostic tool, turning raw data into strategic actions that fix your funnel before a small leak becomes a flood.
Decoding the Story Your Data Tells
Let’s say you open your dashboard and spot a problem: your lead-to-opportunity conversion rate has tanked by 15% this quarter. That’s a classic funnel weakness. An inexperienced manager might just crack the whip and tell the team to "work harder." A data-driven leader knows this is just a symptom of something deeper.
What could be causing the drop? It’s rarely just one thing.
- Bad Lead Quality: Maybe Marketing launched a new campaign that’s driving a ton of clicks but attracting low-intent prospects.
- Weak Qualification: Your reps might be struggling to ask the right discovery questions, failing to uncover real pain points and urgency.
- A Clunky Handoff: The process for passing leads from marketing to sales could be slow, letting perfectly good leads go cold.
By isolating the metric, you can stop guessing and start asking the right questions to find the root cause.
Pinpointing the Leak with Stage-by-Stage Analysis
To really get to the bottom of it, you have to zoom in. This is where tracking win rates by sales stage becomes your secret weapon. It lets you see exactly where deals are stalling and falling through the cracks, making your entire sales process transparent.
High-performing teams live and die by this metric. It breaks down how effectively deals move from one stage to the next, shining a spotlight on where the funnel is leaking. Top teams often hit a 40-50% lead-to-opportunity conversion, but that might drop to 25-30% by the proposal stage. You can learn more about how leading teams track these metrics and what to aim for.
A low conversion rate from the "Demo" stage to the "Proposal" stage probably doesn't mean your proposals are bad. It’s far more likely your demos aren't connecting your product's features to the prospect's most urgent problems.
This granular view transforms your coaching from generic advice into targeted, actionable support.
Turning Insights into Actionable Fixes
Once you’ve identified the specific stage where deals are dying, you can roll out precise fixes. This is what separates the best sales organizations from the rest—they use sales efficiency metrics not just to report on the past, but to actively shape the future.
Let’s walk through a couple of common scenarios:
The Problem: A high drop-off rate right after the initial Discovery call.
- The Likely Cause: Reps aren't building enough value or creating a sense of urgency.
- The Fix: Roll out a coaching program focused on pain-finding questions and storytelling. Jump into call recordings from this stage to find out what’s going wrong.
The Problem: Your sales cycle is getting longer, with deals getting stuck in the "Negotiation" stage.
- The Likely Cause: Reps either lack the skills to handle objections or don't have clear guidance on discounting.
- The Fix: Run a workshop on objection handling. Create a simple "give-get" framework for negotiations so reps feel empowered to close confidently.
By using your dashboard to pinpoint weaknesses and apply targeted fixes, you create a powerful feedback loop. You measure, diagnose, act, and then measure again—constantly tuning your sales engine for maximum efficiency and predictable growth.
Common Questions About Sales Efficiency
Getting started with sales efficiency metrics always kicks up a few practical questions. Let's tackle the most common ones that teams run into when they're moving from just knowing the metrics to actually using them to make smarter decisions.
I Track Nothing Today. Where Do I Even Start?
If you're starting from a blank slate, the key is to avoid getting overwhelmed. Don't try to boil the ocean by measuring a dozen things at once.
Instead, zero in on the two metrics that give you the biggest bang for your buck right away:
- Sales Cycle Length: This tells you, flat out, how fast your team turns a conversation into cash. It's a fantastic first look at the overall health of your entire sales process.
- Quota Attainment: The classic for a reason. This is your ultimate bottom line. It shows whether your targets are realistic and if your reps have what they need to win.
Nail these two first. They’ll give you a solid baseline and point you toward the next layer of metrics to explore, like win rates or pipeline velocity.
How Often Should I Be Looking at This Stuff?
The right rhythm depends entirely on the metric. Staring at every number every single day is a recipe for micromanagement and knee-jerk reactions.
A good rule of thumb is to set up a tiered review schedule. Check activity metrics like calls or demos weekly to keep a pulse on effort. For outcome metrics like quota attainment and sales cycle length, zoom out to a monthly or quarterly view to spot the real, meaningful trends.
This keeps you connected to performance without drowning in data or driving your team crazy.
What’s the Single Biggest Mistake People Make?
Easy. Ignoring data quality. You can have the most beautiful dashboard in the world, but if the CRM data feeding it is a mess of inaccurate, incomplete, or duplicated records, it’s completely useless.
Worse, it’s dangerously misleading.
Think about it: if your reps aren't consistently updating deal stages, your sales cycle and win rate calculations will be a fantasy. You'll end up trying to "fix" problems that don't even exist while the real issues fly under the radar. Clean data isn't just a nice-to-have; it's the non-negotiable foundation for everything else.
Ready to eliminate the data entry that ruins your metrics? Add to CRM saves your team over 4 hours a week by capturing and enriching prospect data from the web in a single click, ensuring your CRM is always clean and accurate. Start building a more efficient sales process today.
Start saving time and closing more deals.
Find contact info for your prospects on the #1 business social network and add them to your CRM with 1-click.
Trusted by 1000s of founders, SDRs & more